What is educineq?
educineq is an R package to compute education inequality measures for any group of countries using the dataset developed by Vanesa Jordá and José Manuel Alonso, which covers 142 countries over the period 1970 to 2010. Our estimates rely on a number of assumptions, so we suggest you read this paper carefully before start using the package.
The package offers the possibility to easily compute not only the Gini index, which has been the main indicator used to measure education inequality, but also generalized entropy measures (GE(α)) for different values of the α parameter. This family of inequality measures presents two main advantages:
- They allow the user to change the sensitivity if the measure to differences in specific parts of the distribution. In particular, we provide functions to compute the mean log deviation (MLD), which is more sensitive to the bottom part of the distribution; the Theil’s entropy measure, equally sensitive to all parts of the distribution; and finally, the GE measure when the sensitivity parameter is set equal to 2, which gives more weight to differences in higher education.
- These measures are additively decomposable, being overall inequality the sum of the following in two components:
- Between-country inequality: The amount of inequality that would exist in an imaginary world where all the all the citizens of a country had the same number of years of schooling, so the only differences would be observed in across countries.
- Within-country inequality: Constructed as a weighted average of inequality measures for the individual countries, the disparities are exclusively derived from the differences in education among the citizens of the same country.
How to use educineq?
The first step is to download R and install it in your computer. You can just work with R, but I recommend using RStudio for new users, since it provides a friendlier environment to process R programming language. Once you verify R is installed and working in your computer, download RStudio and install it.
The next step is to install the package using the following command:
install.packages("educineq", dependencies = TRUE)
You only have to install the package once, but it has to be loaded into R every time you start RStudio, using the command:
library(educineq)
That’s it! The following functions, included in educineq, are already available:
- Mean years of schooling: emean
- Gini index: egini
- Theil index: etheil
- MLD: emld
- GE(2): ege2
- Probability distribution function of education: epdf
- Cumulative distribution function of education: ecdf
All these functions go with a list of arguments in parenthesis:
(countries, init.y, final.y, database, plot)
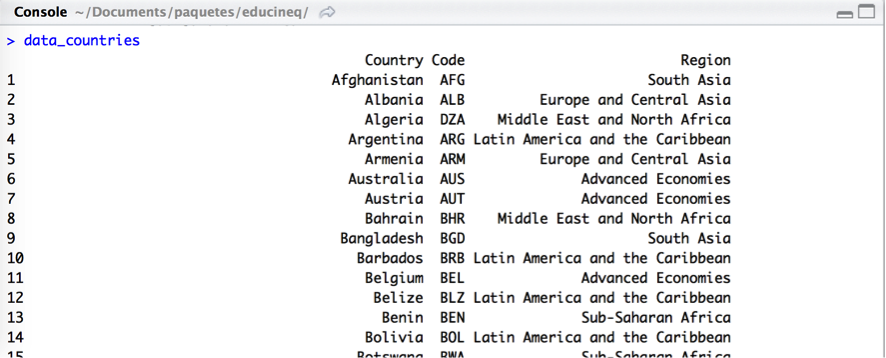
- countries: The countries to be used, which have to be included using the country code that can be found in the object country_data:
- init.y: The first year in which the function is calculated. All these years are available: 1970,1975,1980,1985,1990,1995,2000,2005,2010.
- final.y: The last year in which the function is calculated. The same years as for init.y are available, but it obviously has to be later than the former one.
- database: The functions can be computed for different populations subgrups:· Total population aged over-15: total15· Total population aged over-25: total25· Male population aged over-15: male15· Male population aged over-25: male25
· Female population aged over-15: female15
· Female population aged over-25: female25
- plot: if TRUE (default) shows a graph of the results.
Example
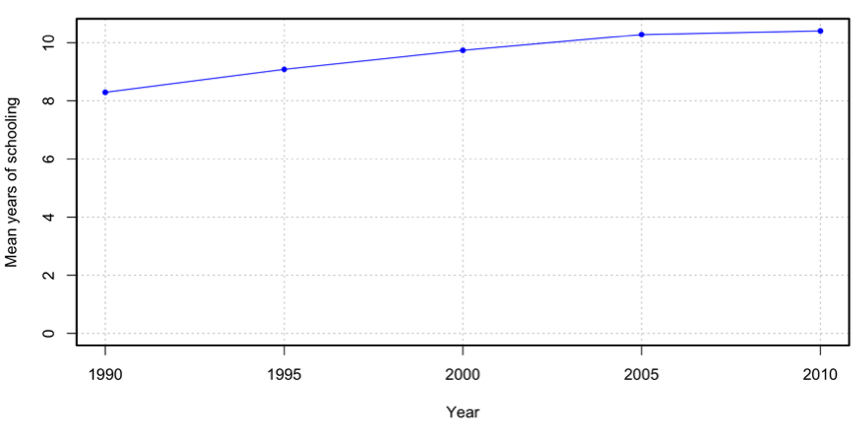
Let’s say we are interested in educational attainments of the Nordic countries (Denmark, Finland, Iceland, Norway and Sweden) since 1990. We can obtain mean years of schooling for the population aged over-15 easily as follows:

The function first shows mean years of schooling for the Nordic countries, and the list of countries used to construct the previous figures. It is important to check the list in order to certify if all the countries has been included.
The option plot = TRUE displays the following graph with the evolution of this indicator:
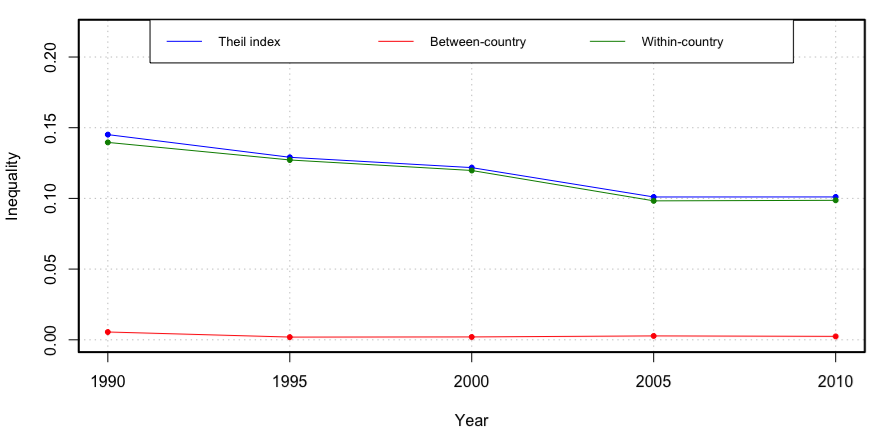
 To measure inequality in education during this period using the Theil index we have to use etheil, which displays this inequality measure decomposed by the differences between countries and disparities within the countries for this region.
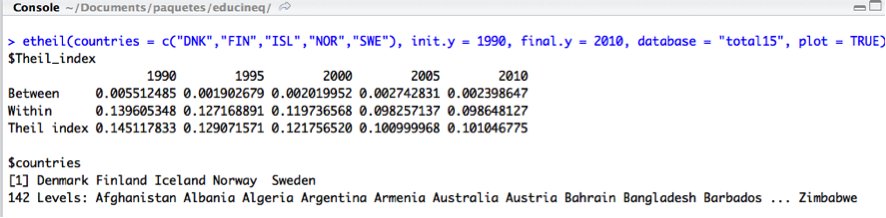
As for the mean years of schooling, the option plot = TRUE displays a graph of the previous results:
In the dataset country_data, a classification of the countries by macro-regions is provided, which can me used to specify the countries in all the functions of educineq. As an example, we compute below the level of educational inequality of Latin America and the Caribbean from 1980 to 2000 using the MLD:

If we set countries = “all”, the whole set of countries included in the dataset will be used to calculate the results. We illustrate how to compute the Gini index for all the countries from 1990 to 2000 for female population aged over-25 in the following figure:

We can also use this package to plot the distribution of educational attainment using epdf for the probability density function and ecdf for the cumulative distribution function.
 Error messages
There are a number of ways to specify wrongly each of the arguments of the functions, in which case the package will report an error or a warning message. Some of the most common errors are presented below along with some recommendations to avoid them.
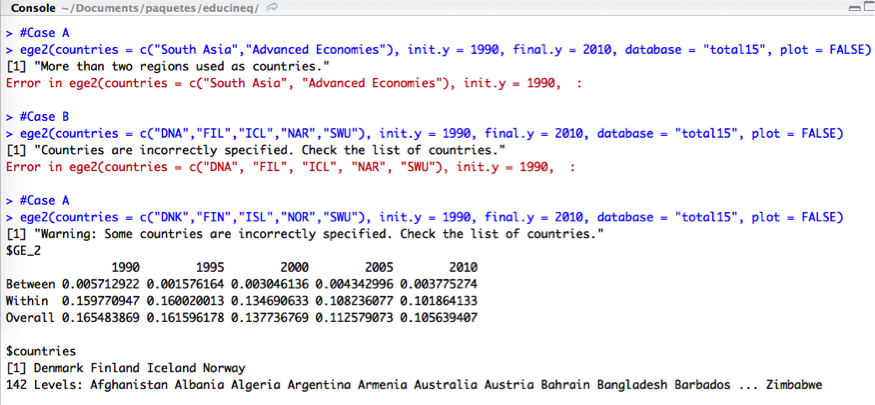
Regarding the first argument related to the countries, the program will stop if more than two regions are chosen simultaneously (Case A); if any of the countries are correctly included with the country code (Case B); and if only some of them are incorrectly specified, the program will compute the results for the countries that has been properly included (Case C). Therefore, it is highly recommended to check the list of countries disliked below the results to avoid possible mistakes due to misspecification of country names.
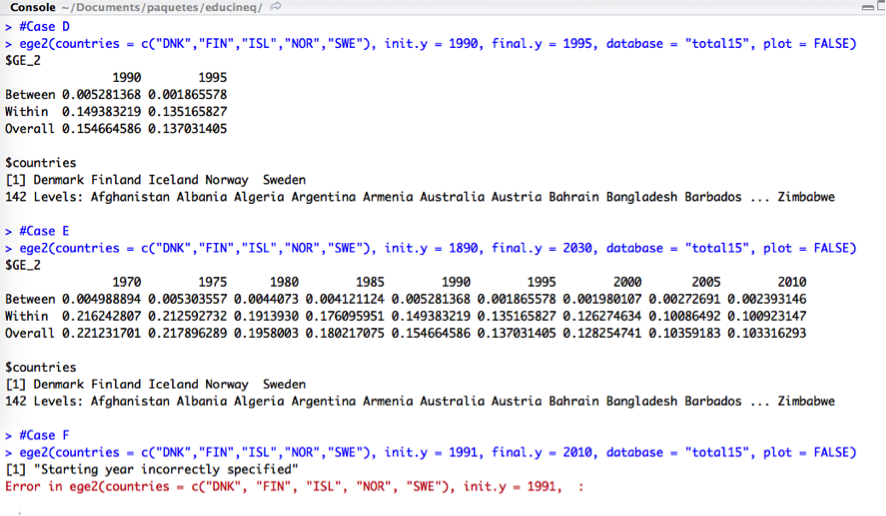
It is also very easy to get confused with the initial and the final year of the period for which the user wants to compute the results. The first year (init.y) has to be earlier than the last year (final.y), otherwise the function yields an error (Case D). The both have to be within the range 1970 – 2010, although if an initial year earlier than 1970 is specified, the function will take 1970 as a starting year and the same logic is applied for the final year, which will be 2010 whenever a later year is chosen (Case E). If the first and the last years are both within the available range, but some (or both) of them are not equal to any of the following values: 1970, 1975, 1980, 1985, 1990, 1995, 2000, 2005, 2010, an error will be displayed (Case F).
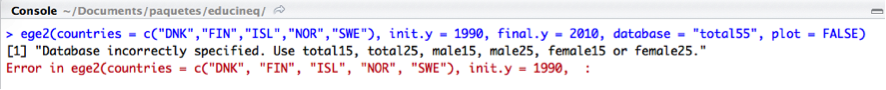
Finally, if the database is not correctly specified, an error will come up, as is illustrated bellow: